
What’s Your Home Worth?
Instant Online Home Value Report
Snohomish County Real Estate Market Report- July 2025
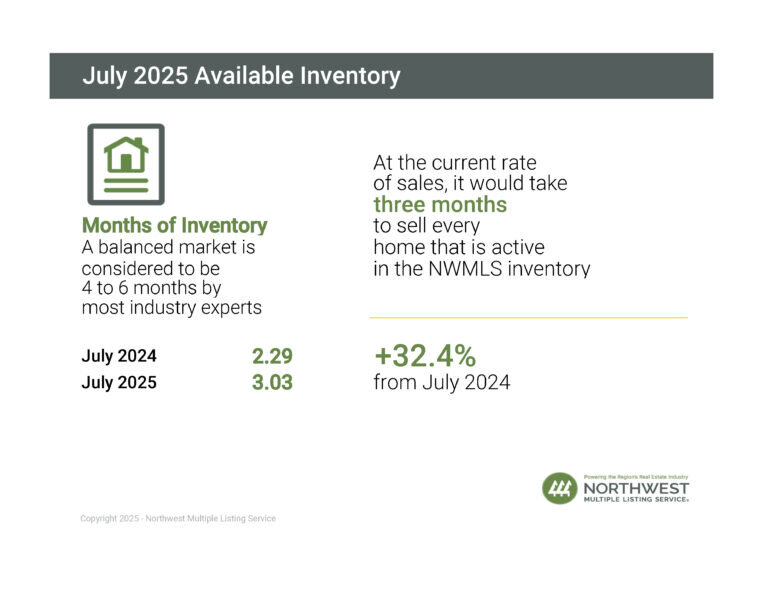
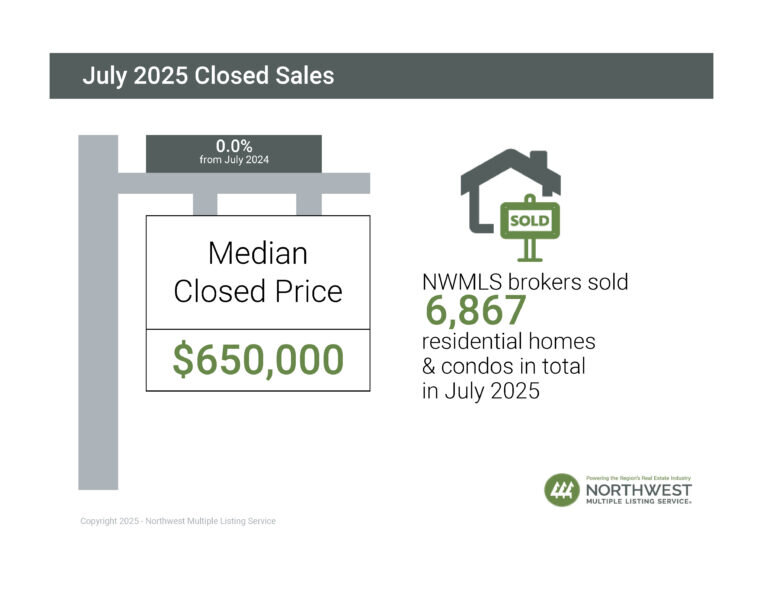
The real estate market is showing significant signs of increased activity and inventory growth across the NWMLS region. The total number of active listings surged by over 37% year-over-year, reaching more than 20,700 properties by the end of July 2025, indicating more choices for buyers compared to last year. Inventory also rose month-over-month by nearly 5%, reflecting a gradual easing from the historically tight supply. Most counties experienced notable inventory gains, with Snohomish County seeing an impressive 53.56% increase, suggesting the market is becoming more competitive and less constrained by limited options. Closed sales rose modestly by nearly 4% year-over-year and 2.6% month-over-month, demonstrating steady buyer demand despite the larger inventory. The median sales price held steady at $650,000 compared to last year but saw a slight decline from the previous month, indicating some price stabilization after recent highs. Notably, premium markets like San Juan, King, and Snohomish counties continue to lead with the highest median prices. Overall, this data suggests the region is transitioning toward a more balanced market where buyers have more options, sales activity remains strong, and prices are stabilizing, setting the stage for a dynamic but sustainable real estate environment moving forward.
In Snohomish County, July 2025 began with:
- 1,106 New Listings
- 2.07 Months’ worth of Inventory
- Median home price of $860,000
Data in these graphics includes all of Washington State, not just Snohomish County.
Let’s break it down per city:
| CITIES | MEDIAN SALES PRICE | % CHANGE OVER LAST YEAR | MONTHS OF INVENTORY |
| BOTHELL | $1,175,948 | -0.55% | 2.45 |
| LYNWOOD | $850,000 | -6.85% | 1.84 |
| EVERETT | $814,000 | -1.33% | 1.70 |
| SNOHOMISH | $700,000 | -3.97% | 2.62 |
| LAKE STEVENS | $750,000 | 5.63% | 2.87 |
| MARYSVILLE | $677,475 | 3.30% | 2.50 |
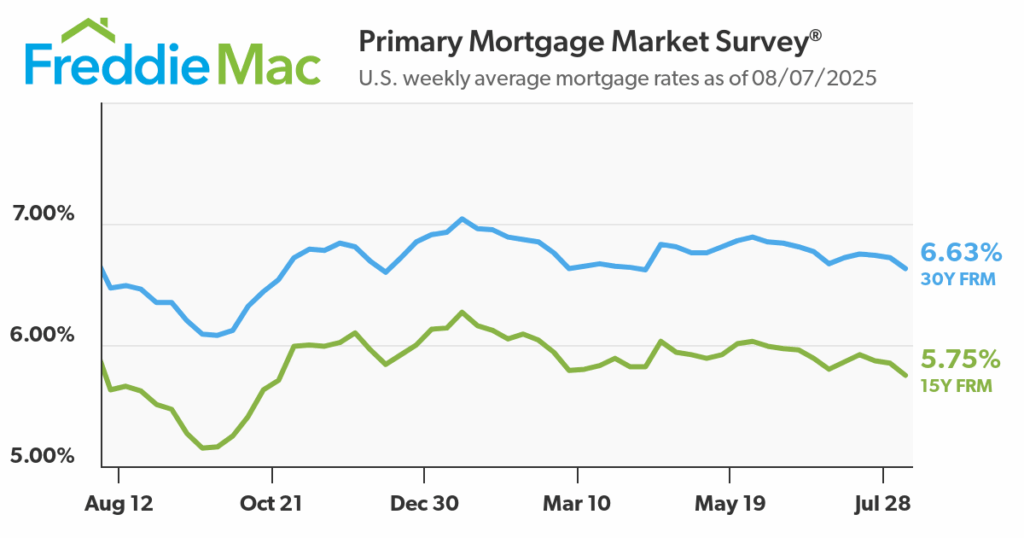
Interest Rates
What Does This Data Mean?

If you’re looking to buy a home in Snohomish County, the data suggests a promising and somewhat more balanced market compared to previous years. Inventory has increased significantly—by over 53% year-over-year—which means you’ll likely find more homes available to choose from than before. This expanded supply gives buyers more options and potentially less pressure to make quick decisions. At the same time, closed sales have also increased slightly, showing that demand remains steady. While prices have held firm, with the median home price around $765,000, recent months have seen some price stabilization, which could make it a good time to negotiate or find value. Overall, buyers in Snohomish County can expect a more competitive but fair market, with better opportunities to find the right home without the intense scarcity seen in prior years.
If you’re selling a home in Snohomish County, this data offers some encouraging insights. The significant increase in active listings, up over 53% year-over-year, means more competition from other sellers, so pricing your home strategically is more important than ever. However, the steady rise in closed sales shows that buyer demand remains solid, which can help your home sell if it’s well-priced and marketed. The median sales price holding strong around $765,000 indicates that the market is stable, so you’re unlikely to see major price drops, but you might not see rapid price gains either. Overall, it’s still a seller’s market, but with more inventory, you’ll want to highlight what makes your home stand out and be prepared for buyers to have more options.
Search For Snohomish County Homes Here
What’s Your Home Worth?
Instant Online Home Value Report