
What’s Your Home Worth?
Instant Online Home Value Report
Click here for a current- at a glance look at the Snohomish County Real Estate Housing Forecast… Please continue reading for our expanded report.
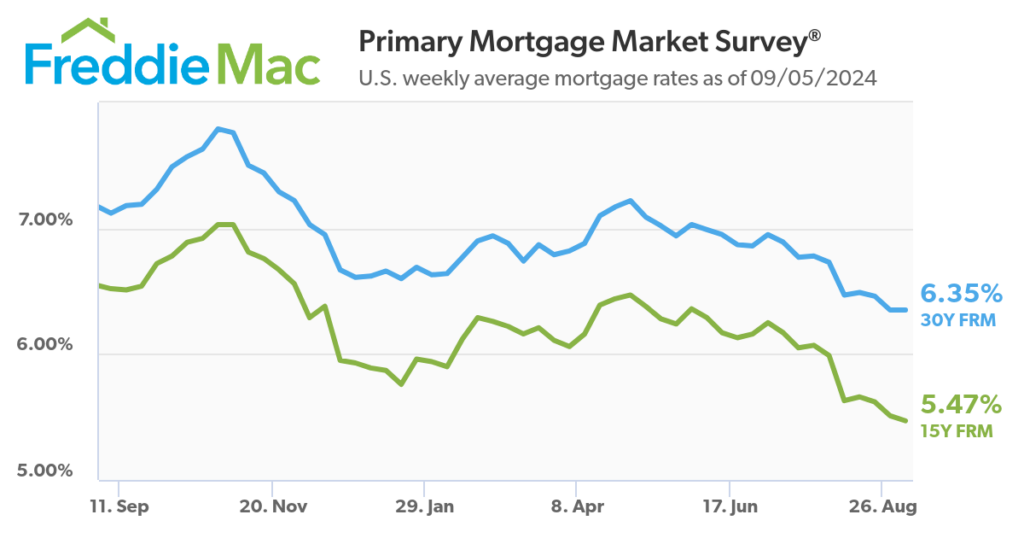
Mortgage rates are at their lowest level since March 2023 (6.35% for a 30-year fixed rate mortgage as of August 29th), and August 2024 reflected year-over-year increases in the number of active listings, new listings and pending sales. At the same time, the number of closed sales year-over-year was virtually unchanged, and median home prices rose in 20 of the 26 counties covered by NWMLS. The Federal Reserve is expected to reduce interest rates in September further, sending encouraging signals to potential buyers.
August 2024 Key Takeaways
Median Sales Price
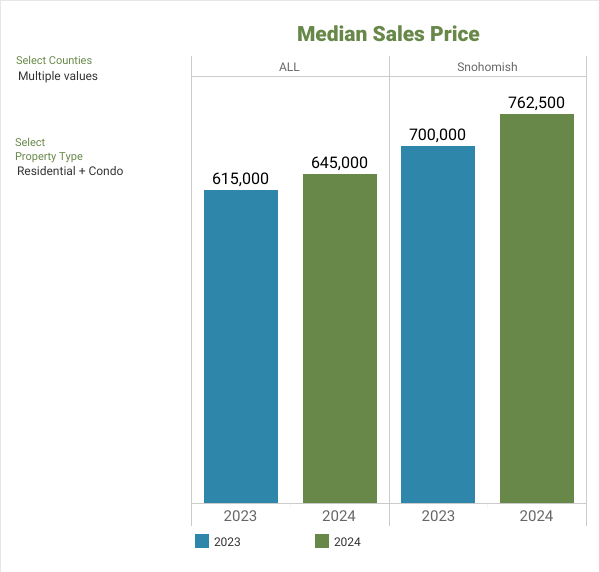
- Overall, the median price for residential homes and condominiums sold in August 2024 was $645,000, an increase of 4.9% when compared to August 2023 ($615,000).
- The three counties with the highest median sale prices were San Juan ($905,000), King ($860,000) and Snohomish ($762,500), and the three counties with the lowest median sale prices were Ferry ($282,500), Adams ($307,475) and Pacific ($332,500).
Active Listings
- The total number of properties listed for sale increased by 34.1%, with 15,453 active listings on the market at the end of August 2024, compared to 11,525 at the end of August 2023.
- The number of homes for sale increased throughout Washington, with 25 out of 26 counties seeing a double-digit year-over-year increase.
- The five counties with highest increases in active inventory for sale were Douglas (+65.1%), Mason (+49.2%), Lewis (+49%), Pacific (+48%) and Pierce (+43%).
Closed Sales Transactions
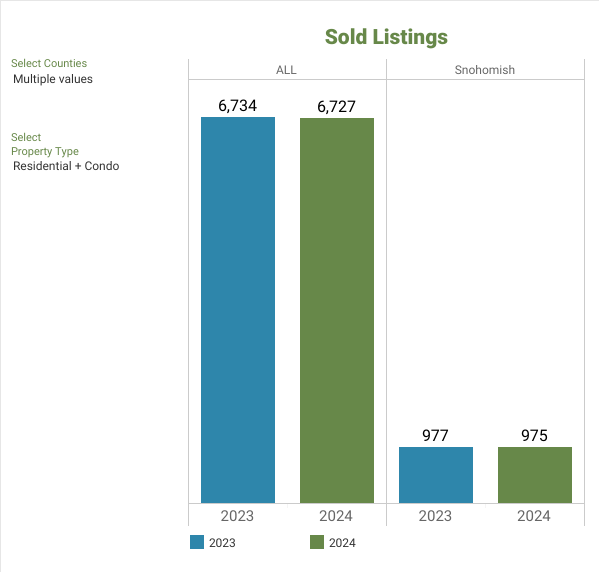
- The number of closed sales remained relatively unchanged year-over-year (6,727 in August 2024 compared to 6,734 in August 2023).
- The number of closed sales increased in 15 out of 26 counties year over year, while it decreased in 11.
“Mortgage interest rates have already started to moderate, dropping to 6.35% (for 30-year terms) at the end of August from this year’s high of 7.22% at the beginning of May,” said Steven Bourassa, director of the Washington Center for Real Estate Research (WCRER) at the University of Washington. “Unfortunately, lack of supply will continue to affect house prices. Single and multi-family permitting dropped off noticeably in 2022 as interest rates ramped, and single-family home prices will likely continue to increase as interest rates drop.”
Consumer and Broker Activity
NWMLS also provided insights into consumer activities during August 2024:
- Keyboxes located at listed properties were accessed 159,239 times in August 2024, a 2% increase in activity from July 2024 when they were accessed 156,268 times.
- The total number of property showings scheduled through NWMLS-provided software saw a 2% increase from July 2024 (117,298 showings) to August 2024 (119,927 showings).
- In August 2024, 18,028 listed properties were eligible for the Down Payment Resource (DPR) program offered by NWMLS, an increase of 3% over July 2024.
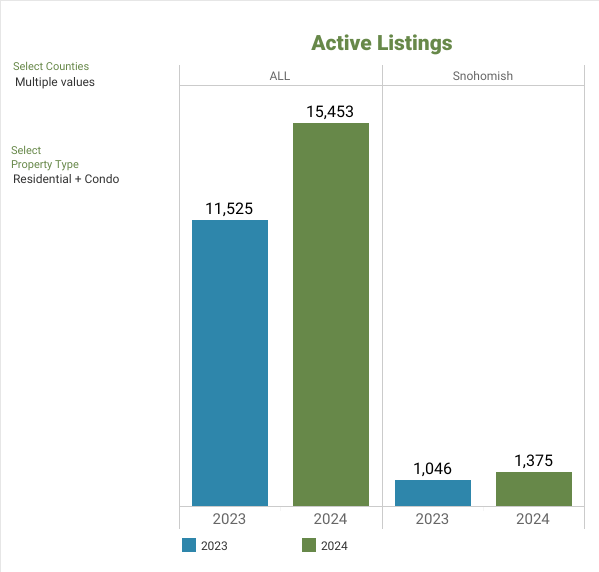
Active Listings
Inventory of residential and condominium properties listed for sale (that have not yet accepted an offer).
There was a 34.1% increase in total number of properties listed for sale, with 15,453 active listings on the market at the end of August 2024, compared to 11,525 at the end of August 2023. The number of homes for sale increased throughout Washington, with 25 out of 26 counties seeing a double-digit year-over-year increase. The five counties with highest increases in active inventory for sale were Douglas (+65.1%), Mason (+49.2%), Lewis (+49%), Pacific (+48%), and Pierce (+43%).
Below is a graph of Snohomish County & ALL pending sales in all 23 counties:
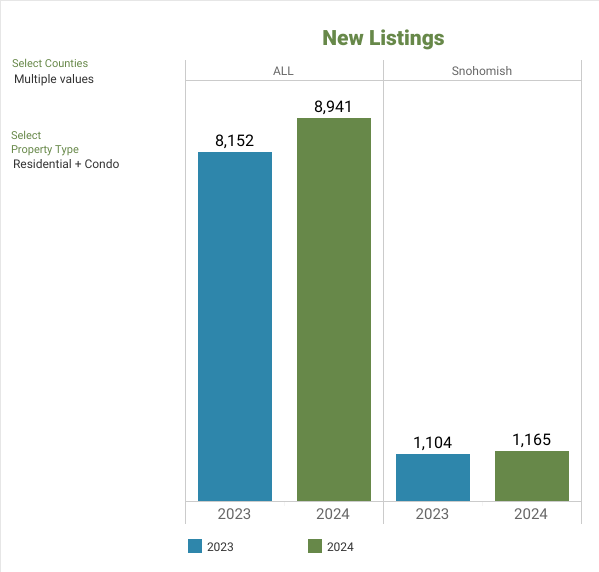
New Listings
Residential and condominium properties added to the inventory during the reporting period (included in active listing totals).
NWMLS brokers added 8,941 new listings to the database in August 2024, an increase of 9.7% compared to August 2023 (8,152). The five counties with the largest increase in the number of new listings added to the NWMLS database last month were Ferry (+83.3%), Douglas (+45.5%), Pacific (+43.4%), Clallam (+34.7%), and San Juan (+28.1%).
Below is a graph of Snohomish County & ALL pending sales in all 23 counties:
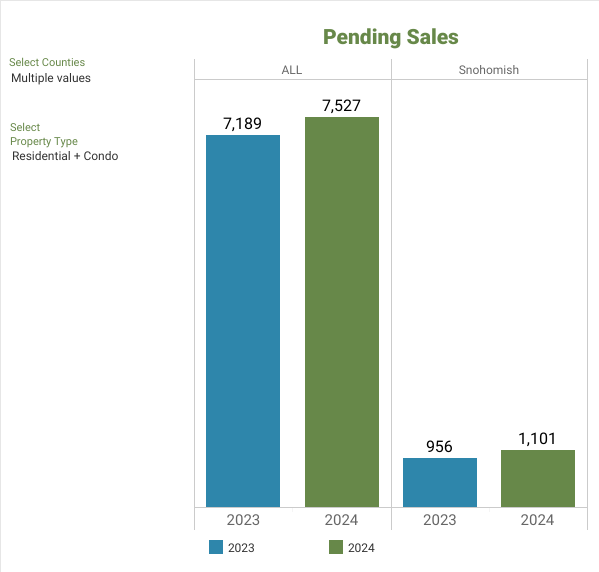
Pending Sales
Residential and condominium properties where buyer and seller have signed the purchase and sale agreement, but the transaction has not closed (pending arrangements for financing, home inspection, sale of buyer’s home, or other reasons). Figures include all transactions that became “pending” during the period unless the listing returned to the market during the same period.
There were 7,527 total residential units & condo units under contract in August 2024, an increase of 4.7% when compared to August 2023 (7,189). 13 out of 26 counties saw a year-over-year increase in the number of pending listings, with the highest year-over-year increases in Ferry (+60%), Douglas (+35.1%), Clallam (+33.8%), Walla Walla (+19.6%), Snohomish (+15.2%), and Skagit (+12.5%).
Below is a graph of Snohomish County & ALL pending sales in all 23 counties:
Closed Sales
Residential and condominium sale transactions that have closed (the final procedures in a real estate sale during which ownership of property transfers from seller to buyer in accordance with a contract), documents are executed and/or recorded, and funds are available to the seller. NWMLS monthly statistical reports use the “Status Date” (the date that the listing status was changed to “Sold” in Matrix.)
The number of closed sales remained virtually unchanged year-over-year (6,727 in August 2024 compared to 6,734 in August 2023). 15 out of 26 counties saw an increase in closed sales year-over-year, while 11 saw a decrease. The total dollar value of closed sales in August 2024 for residential homes was $4,922,153,308 and $497,416,449 for condominiums, an increase of 4.7% when compared to August 2023.
Below is a graph of Snohomish County & ALL pending sales in all 23 counties:
Months of Inventory
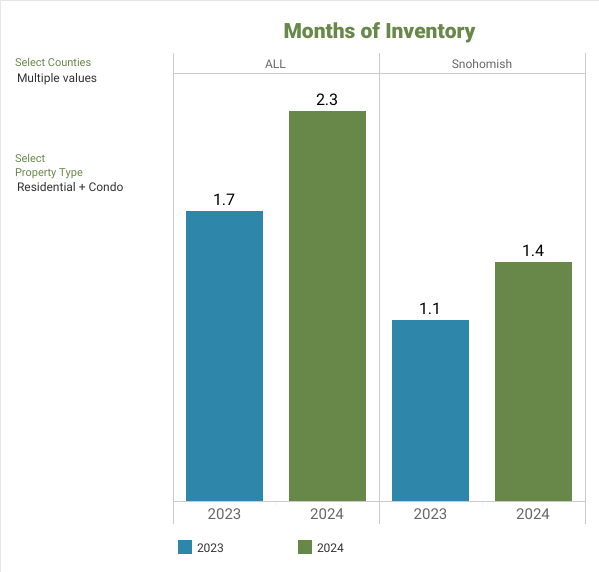
The ratio of active listings to closed sales (derived by dividing the total number of active listings on the market by the total number of closed sales).
A balanced market is considered to be 4 to 6 months by most industry experts. At the current rate of sales, it would take a little over two months (2.30) to sell every home that is active in the NWMLS inventory. The six counties with the lowest months of inventory in August 2024 were Snohomish (1.41), Kitsap (1.61), Thurston (1.7), King (2.08), Pierce (2.08), and Skagit (2.23).
Below is a graph of Snohomish County & ALL pending sales in all 23 counties:
Median Price
The “median” price means an equal number of units sold at a higher and lower value, with the middle value being the median. Example: If you wanted to find the median sales price for 5 listings with sales prices of $100,000, $200,000, $250,000, $300,000, and $600,000 – the price in the middle of the list is $250,000.
Overall, the median price for residential homes and condominiums sold in August 2024 was $645,000, an increase of 4.9% when compared to August 2023 ($615,000). The three counties with the highest median sale prices were San Juan ($905,000), King ($860,000), and Snohomish ($762,500), and the three counties with the lowest median sale prices were Ferry ($282,500), Adams (%307,475), and Pacific ($332,500).
Below is a graph of Snohomish County & ALL pending sales in all 23 counties:
Where do we go from here?
Now is still a great time to sell your home as home values are holding strong and we do have pent-up buyer demand, the overpriced have tapered off (somewhat), so sellers need to be reasonable in this more balanced market. Buyers now have a slight increase in inventory, giving them options. Buyers have more homes to choose from and we are seeing contingencies and finance options return. Although we are seeing some price adjustments I don’t recommend postponing purchasing, home values are expected to continue to rise in our area. If you think you are saving money by waiting, you should run the numbers. Economists and pundits in real estate all say “buy now”. The anticipated increase in equity across the next two-to-four years will be astonishing.
Northwest MLS Market Report
Last month, there were 2.3 months of supply system-wide. Interest rates are still a concern for buyers; they are starting to get used to these current rates, and creative financing has returned. For the most part, we are returning to the “Pre-COVID” real estate market, which was considered very strong, just unlike the fierce market we have experienced in the last few years.
We continue to see price appreciation year-over-year in most areas. Potential sellers should act now, as this is still an excellent time to put their homes on the market. I will continue to follow the market trends and inform you each month as we move through summer.
Let’s get coffee, chat, or email back and forth if you have any questions about selling or buying real estate. If you want to know what your home is worth, have an interest in a particular area, or want to be put on a search to follow the market and home prices, just let me know. My team & I have many tools to help you make sound investment decisions!
Take a look at Snohomish County Housing Statistics.
June began with:
- 1,165 New Listings
- 1.41 months’ worth of Inventory
- Median home price of $762,500
Let’s break it down per city:
| CITIES | MEDIAN SALES PRICE | % CHANGE OVER LAST YEAR | MONTHS OF INVENTORY |
| BOTHEL | $1,100,000 | 2.33% | 1.24 |
| LYNNWOOD | $820,000 | 2.50% | 1.31 |
| EVERETT | $741,000 | 13.52% | 1.33 |
| SNOHOMISH | $650,000 | 1.56% | 1.54 |
| LAKE STEVENS | $678,000 | -.66% | 1.50 |
| MARYSVILLE | $655,000 | 4.80% | 1.71 |
What Does This Data Mean?

Inventory levels continue to be an issue in some places. Most places have under a month’s supply available; we are still in a seller-based market. However, we are moving to a balanced market. A balanced market is considered when we have approximately 4-6 months” worth of inventory. Due to the ongoing demand for real estate in Greater Seattle, I expect a slow to robust real estate market going through 2024. We have seen prices holding steady to a slight softening, but I believe prices will continue to increase in the North Sound Region as we move through 2024, especially along the I-5 corridor.

What Does This Mean If You Are Buying A Home in Snohomish County
If you are buying a home in Snohomish County, you will see a pinch in inventory; you may have to act quickly. Buyers are out there and very serious, driving up prices in many cases. Buyers looking for single-family homes and condos are seeing price increases. Interest rates have come down to a somewhat more attractive level, increasing buyer activity. Be sure you are working with an experienced and knowledgeable agent when forming an offer and guiding through negotiations.
As of January 1st, 2024, buyers and agents must be in a “signed” Buyers Brokerage Services Agreement before entering homes. This is a NEW Washington state law. This new agreement clarifies agent commissions and makes the buying process more transparent. As the designated broker of Keller Williams North Sound in Marysville, I’m on top of form revisions, real estate law & compliance.
This is the perfect time to sign up and receive email notifications when a new home is listed in the Snohomish County real estate market. Email and instant alerts give you an advantage over other buyers looking for homes. Please fill out our form below so we can keep you ahead of the competition!
Ask Amy for an Email alert when a Snohomish County Home becomes available.

What Does This Mean If You Are Selling A Home In Snohomish County
If you are selling a home in Snohomish County, buyers are eager and shopping. This is still a seller’s market, and most sellers are getting their asking price and commonly getting over their list price.
Competition means your home needs to be priced competitively. Double-check to make sure your property is in optimum selling condition.
Check the home valuation calculator to get an estimated value of your home. Contact us to get a comprehensive report. We work closely with sellers to create a marketing strategy that gets your listing in front of buyers wanting to buy.
-Amy Wagner
425.239.2723
What’s Your Home Worth?
Instant Online Home Value Report
Month-by-Month Comparison and In-depth Market Reports
| JANUARY 2021 | JANUARY 2022 |
| FEBRUARY 2021 | FEBRUARY 2022 |
| MARCH 2021 | MARCH 2020 |
| APRIL 2021 | APRIL 2020 |
| MAY 2021 | MAY 2020 |
| JUNE 2021 | JUNE 2020 |
| JULY 2021 | JULY 2020 |
| AUGUST 2021 | AUGUST 2020 |
| SEPTEMBER 2021 | SEPTEMBER 2020 |
| OCTOBER 2021 | OCTOBER 2020 |
| NOVEMBER 2021 | NOVEMBER 2020 |
| DECEMBER 2021 | DECEMBER 2020 |
5 Things You Can Do To Make Your House Stand Out
How To Prepare Your Snohomish County House For Sale Post Pandemic

About Amy Wagner – Prime Listings Group
“When You Do What You Love…People Love What You Do”
As a real estate agent, investor and managing broker of Keller Williams North Sound, Amy particularly loves helping people sell their homes fast and teaching and helping people build wealth through real estate investments such as multi-family homes, land development and the fix & flip of houses. She founded Prime Listings Group on the principles of doing better and giving more. We have local experience on our side and we promise to give more than expected. You’ve come to the right place. At PLG you can expect better!

“Great service from the start until closing….”
Amy sold my house quick and for more than I expected. Her whole team was excellent. Great service from the start until closing 10 out of 10⭐️’s!!! Thank you 🙏🏽 Amy Wagner