
What’s Your Home Worth?
Instant Online Home Value Report
Northwest MLS, the source for the most current, accurate market listing data in Washington state has released its Market Snapshot for April 2025.
Market Recap
Traditionally a busier month in the spring season, April’s activity continued the year-over-year growth trends observed in market activity over the last twelve months. The number of closed sales slightly increased by 0.7% year-over-year (5,887 in April 2025 compared to 5,847 in April 2024), and NWMLS brokers added 10,858 new listings to the database in April 2025, an increase of 12.7% compared to April 2024 (9,636).
For-sale inventories are continuing to rise from historical lows, and that’s helping bring some life to housing market activity in the NWMLS area.
But questions still abound regarding one of the most critical aspects of today’s market, affordability, and the political and economic factors that influence it.
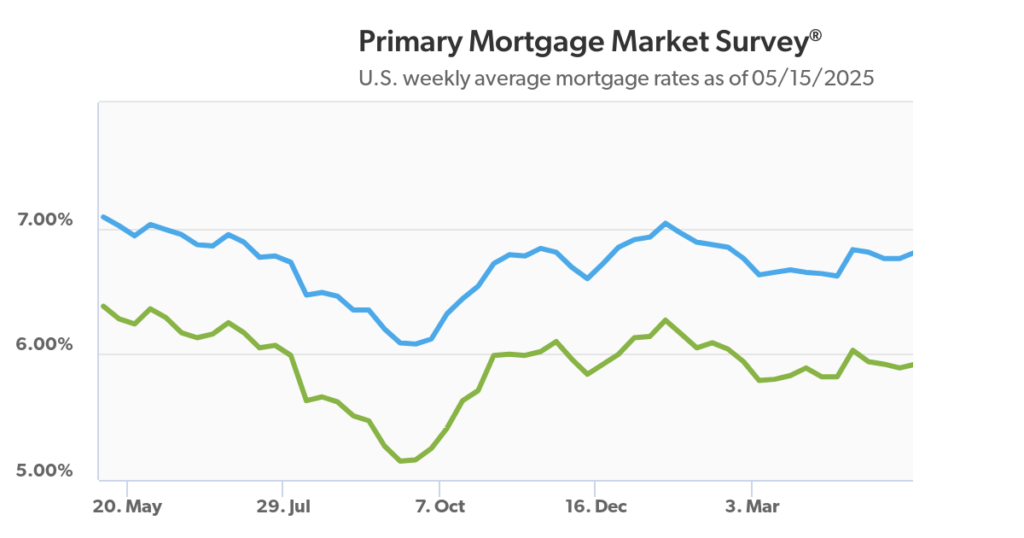
“Both prices and interest rates continued to increase, having a negative effect on affordability,” said Steven Bourassa, director of the Washington Center for Real Estate Research (WCRER) at the University of Washington. “The median price rose by nearly 4% to $615,000, while interest rates rose from 6.69% at the end of January 2024 to 6.95% now.”
“Moreover, new immigration policies are expected to have an inflationary impact on home construction costs,” he continued, “And the National Association of Home Builders has warned that tariffs on imports from Canada and Mexico would have a significant impact on materials such as lumber and gypsum, while multiple researchers have documented the possible impact of immigration policy on labor supply for home builders.”
All of this suggests that the affordability of homeownership, which has been declining, will continue to do so.
April 2025 Key Takeaways
Active Inventory For Sale
- There was a 47.4% increase in total number of properties listed for sale year-over-year, with 14,459 active listings on the market at the end of April 2025, compared to 9,813 at the end of April 2024. When compared to the previous month, active inventory increased by 2,819 listings (+24.2%), up from 11,640 in March 2025.
- The number of homes for sale year-over-year increased throughout the NWMLS coverage area, with 24 out of 26 counties seeing a double-digit year-over-year increase. The six counties with highest year-over-year increases in active inventory for sale were Snohomish (+84.8%), Columbia (+76.9%), King (+71.3%), Clallam (+70.7%), Whatcom (+68.1%), and Grant (+59.8%).
Closed Sales
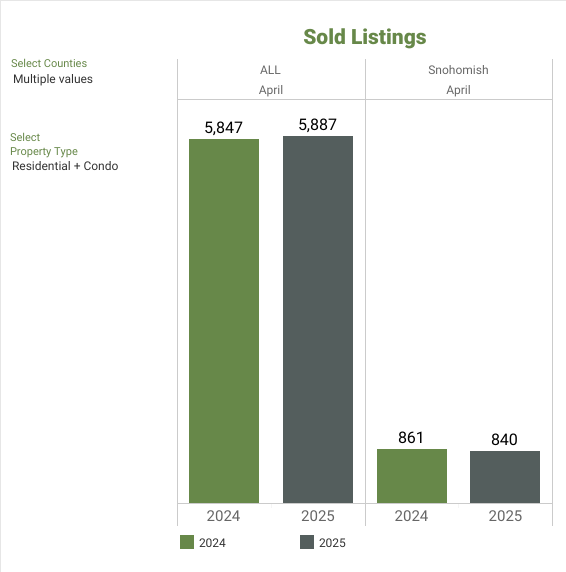
- The number of closed sales slightly increased by 0.7% year-over-year (5,887 in April 2025 compared to 5,847 in April 2024). When compared to the previous month, the number of closed sales increased by 8.9%, up from 5,406 sales in March 2025.
- 10 out of 26 counites saw an increase in the number of closed sales year-over-year. The six counties with the largest increases were Grays Harbor (+54%), Kittitas (+44.9%), Clark (+36.9%), Island (+29.9%), Chelan (+28.9%), and Skagit (+23.5%). The total dollar value of closed sales in April 2025 for residential homes was $4,393,208,459 and was $523,944,227 for condominiums $4,917,152,685 in total), an increase of 1.2% when compared to April 2024.
Median Sales Price
- Overall, the median price for residential homes and condominiums sold in April 2025 was $650,000, a slight decrease of 0.2% when compared to April 2024 ($651,000). When compared to last month, the median price did not change ($649,999 in March 2025).
- The three counties with the highest median sale prices were King ($907,000), Snohomish ($755,500), and San Juan ($665,000), and the three counties with the lowest median sale prices were Okanogan ($289,000), Columbia ($305,000), and Adams ($310,000).
Active Listings
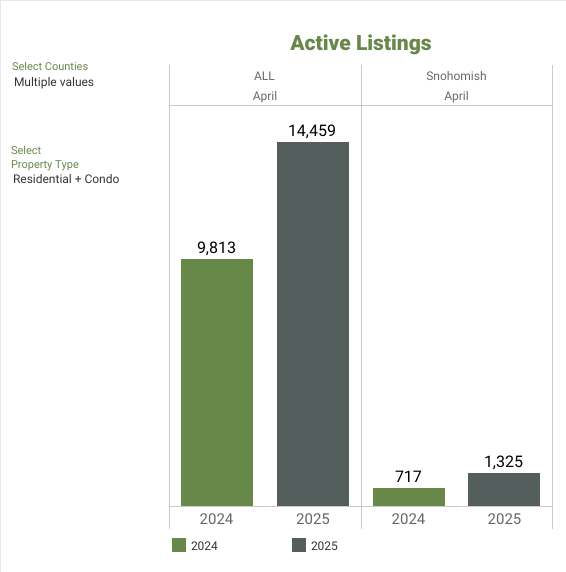
There was a 47.4% increase in total number of properties listed for sale year-over-year, with 14,459 active listings on the market at the end of April 2025, compared to 9,813 at the end of April 2024. When compared to the previous month, active inventory increased by 2,819 listings (+24.2%), up from 11,640 in March 2025.
The number of homes for sale year-over-year increased throughout the NWMLS coverage area, with 24 out of 26 counties seeing a double-digit year-over-year increase. The six counties with highest year-over-year increases in active inventory for sale were Snohomish (+84.8%), Columbia (+76.9%), King (+71.3%), Clallam (+70.7%), Whatcom (+68.1%), and Grant (+59.8%).
Below is a graph of Snohomish County & ALL active listings in all 23 counties:
New Listings
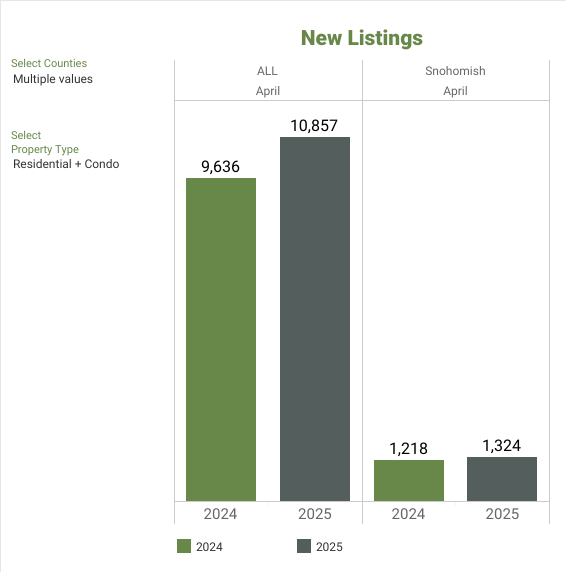
NWMLS brokers added 10,858 new listings to the database in April 2025, a year-over-year increase of 12.7% compared to April 2024 (9,636). When compared to the previous month (March 2025), new listings increased by 18.5%, when 9,161 listings were added to the NWMLS database.
The number of new listings increased year-over-year in 23 of 26 counties. The six counties with the largest year-over-year increases were Columbia (+175%), Adams (+64.7%), Jefferson (+52%), Clallam (+36.5%), Douglas (+34.9%), Pacific (+32.2%), and Whatcom (+30.9%).
Below is a graph of Snohomish County & ALL new listings in all 23 counties:
Pending Sales
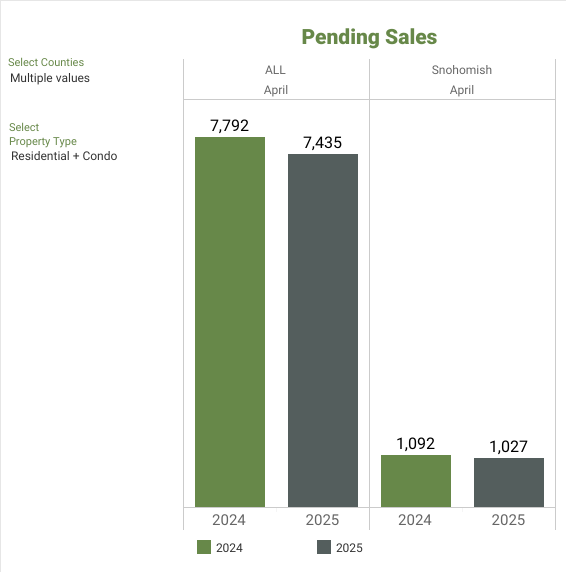
There were 7,435 residential units & condo units under contract in April 2025, a decrease of 4.6% when compared to April 2024 (7,792). When compared to the previous month, the number of pending listings decreased by 2.1%, down from 7,593 listings under contract in March 2025.
Below is a graph of Snohomish County & ALL pending sales in all 23 counties:
Closed Sales
The number of closed sales slightly increased by 0.7% year-over-year (5,887 in April 2025 compared to 5,847 in April 2024). When compared to the previous month, the number of closed sales increased by 8.9%, up from 5,406 sales in March 2025.
10 out of 26 counites saw an increase in the number of closed sales year-over-year. The six counties with the largest increases were Grays Harbor (+54%), Kittitas (+44.9%), Clark (+36.9%), Island (+29.9%), Chelan (+28.9%), and Skagit (+23.5%). The total dollar value of closed sales in April 2025 for residential homes was $4,393,208,459 and was $523,944,227 for condominiums $4,917,152,685 in total), an increase of 1.2% when compared to April 2024.
Below is a graph of Snohomish County & closed sales in all 23 counties:
Months of Inventory
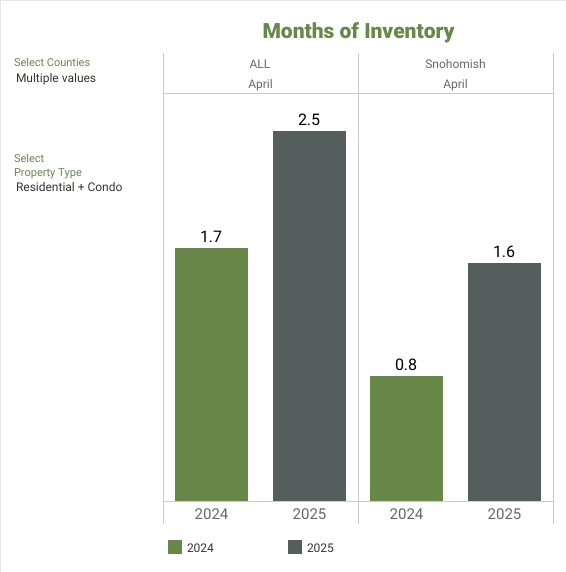
A balanced market is considered to be 4 to 6 months by most industry experts. At the current rate of sales, it would take around two and a half months (2.46) to sell every home that is active in the NWMLS inventory. The six counties with the lowest months of inventory in April 2025 were Snohomish (1.58), Kitsap (1.82), Pierce (1.93), Thurston (1.98), King (2.23), and Skagit (2.23).
Below is a graph of Snohomish County & ALL months of invenory in all 23 counties:
Median Price
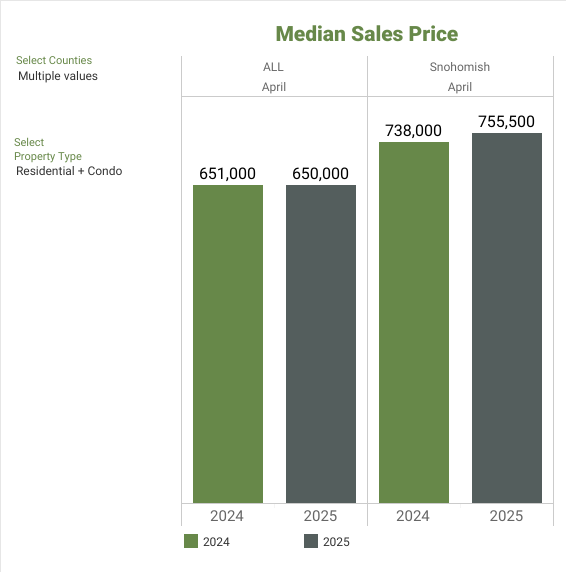
Overall, the median price for residential homes and condominiums sold in April 2025 was $650,000, a slight decrease of 0.2% when compared to April 2024 ($651,000). When compared to last month, the median price did not change ($649,999 in March 2025).
The three counties with the highest median sale prices were King ($907,000), Snohomish ($755,500), and San Juan ($665,000), and the three counties with the lowest median sale prices were Okanogan ($289,000), Columbia ($305,000), and Adams ($310,000).
Below is a graph of Snohomish County & ALL median prices in all 23 counties:
Where do we go from here?
Now remains a strong time to sell your home. Property values are holding steady, and there is still pent-up buyer demand in the market. While the era of overpriced listings has cooled, sellers who price reasonably are finding success in this more balanced environment.
For buyers, the landscape has also shifted. Inventory has increased slightly, offering more options and bringing back the use of contingencies and a broader range of financing choices. Although we’re seeing some price adjustments, waiting to buy may not be the best strategy.
Home values are projected to continue rising in our area. If you’re holding off in hopes of saving money, it’s worth running the numbers. Most real estate experts and economists agree, buying now positions you to benefit from the expected equity growth over the next two to four years, which could be significant.
Northwest MLS Market Report
We continue to see price appreciation year-over-year in most areas. Potential sellers should act now, as this is still an excellent time to put their homes on the market due to low inventory. I will continue to follow the market trends and inform you each month as we move into summer.
Let’s get coffee, chat, or email back and forth if you have any questions about selling or buying real estate. If you want to know what your home is worth, have an interest in a particular area, or want to be put on a search to follow the market and home prices, just let me know. My team & I have many tools to help you make sound investment decisions!
Take a look at Snohomish County Housing Statistics
April began with:
- 1,082 New Listings
- 1.51 Months worth of Inventory
- Median home price of $799,950
Let’s break it down per city:
| CITIES | MEDIAN SALES PRICE | % CHANGE OVER LAST YEAR | MONTHS OF INVENTORY |
| BOTHELL | $1,245,000 | -6.43% | 1.72 |
| LYNNWOOD | $980,000 | -3.06% | 1.15 |
| EVERETT | $775,000 | 7.73% | 1.40 |
| SNOHOMISH | $689,497 | 4.21% | 1.26 |
| LAKE STEVENS | $772,475 | -10.68% | 2.50 |
| MARYSVILLE | $634,990 | 3.94% | 1.46 |
What Does This Data Mean?

Inventory levels remain a challenge in some areas, with most regions currently holding about 1.5 to 2 months’ worth of supply. This still reflects a seller’s market, but we’re gradually trending toward a more balanced market. A balanced real estate market is typically defined by 4 to 6 months of inventory.
In the Greater Seattle area, continued demand is driving a steady and resilient market outlook through 2025. Home prices have remained stable, with slight increases in many areas. I anticipate that this upward trend will continue, particularly in the North Sound Region and along the I-5 corridor, where buyer interest remains strong

What Does This Mean If You Are Buying A Home in Snohomish County
If you are buying a home in Snohomish County, you may see a pinch in inventory in certain locations; you may have to act quickly. Buyers are out there and very serious, often driving up prices. Interest rates continue to be uncertain. Be sure you are working with an experienced and knowledgeable agent when forming an offer and guiding through negotiations.
As of January 1st, 2024, buyers and agents must be in a “signed” Buyers Brokerage Services Agreement before entering homes. This is a NEW Washington state law. This new agreement clarifies agent commissions and makes the buying process more transparent. As a real estate agent of 22+ years, managing broker for thirteen years, and the designated broker of Keller Williams North Sound in Marysville for eleven years, I’m held to a high standard. I am always on top of form revisions, real estate law & compliance!
This is the perfect time to sign up and receive email notifications when a new home is listed in the Snohomish County real estate market. Email and instant alerts give you an advantage over buyers looking for homes. Please fill out our form below so we can keep you ahead of the competition!
Ask Amy for an Email alert when a Snohomish County Home becomes available.

What Does This Mean If You Are Selling A Home In Snohomish County
Buyers are eager and shopping if you are selling a home in Snohomish County. This is still a seller’s market, and most sellers are getting their asking price and commonly getting over their list price.
Competition means your home needs to be priced competitively. Double-check to make sure your property is in optimum selling condition.
Check the home valuation calculator to get an estimated value for your home. Contact us for a comprehensive report! We work closely with sellers to create a marketing strategy that gets their listings in front of buyers.
-Amy Wagner 425.239.2723
What’s Your Home Worth?
Instant Online Home Value Report
5 Things You Can Do To Make Your House Stand Out

About Amy Wagner – Prime Listings Group
“When You Do What You Love…People Love What You Do”
As a real estate agent, investor and managing broker of Keller Williams North Sound, Amy particularly loves helping people sell their homes fast and teaching and helping people build wealth through real estate investments such as multi-family homes, land development and the fix & flip of houses. She founded Prime Listings Group on the principles of doing better and giving more. We have local experience on our side and we promise to give more than expected. You’ve come to the right place. At PLG you can expect better!

“Great service from the start until closing….”
Amy sold my house quick and for more than I expected. Her whole team was excellent. Great service from the start until closing 10 out of 10⭐️’s!!! Thank you 🙏🏽 Amy Wagner