
What’s Your Home Worth?
Instant Online Home Value Report
Northwest MLS, the source for the most current, accurate market listing data in Washington state has released its Market Snapshot for March 2025.
Market Recap
Traditionally a busier month in the spring season, March’s activity continued the year-over-year growth trends observed in market activity over the last twelve months. The number of closed sales increased by 4.7% year-over-year (5,406 in March 2025 compared to 5,165in March 2024), and NWMLS brokers added 9,161 new listings to the database in March 2025, an increase of 14.1% compared to March 2024 (8,028).
For-sale inventories are continuing to rise from historical lows, and that’s helping bring some life to housing market activity in the NWMLS area.
But questions still abound regarding one of the most critical aspects of today’s market – affordability – and the political and economic factors that influence it.
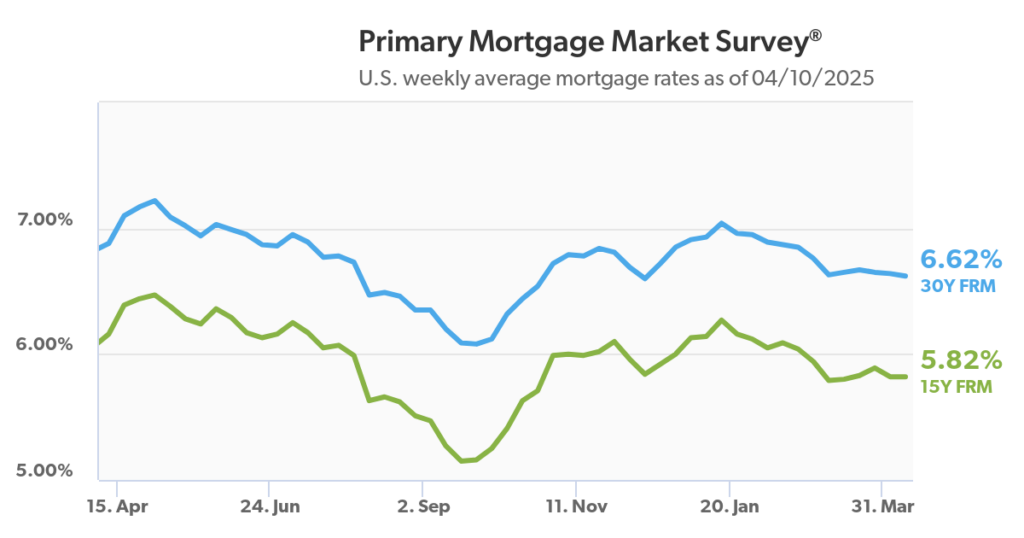
“Both prices and interest rates continued to increase, having a negative effect on affordability,” said Steven Bourassa, director of the Washington Center for Real Estate Research (WCRER) at the University of Washington. “The median price rose by nearly 4% to $615,000, while interest rates rose from 6.69% at the end of January 2024 to 6.95% now.”
“Moreover, new immigration policies are expected to have an inflationary impact on home construction costs,” he continued, “And the National Association of Home Builders has warned that tariffs on imports from Canada and Mexico would have a significant impact on materials such as lumber and gypsum, while multiple researchers have documented the possible impact of immigration policy on labor supply for home builders.”
All of this suggests that the affordability of homeownership, which has been declining, will continue to do so.
March 2025 Key Takeaways
Active Inventory For Sale
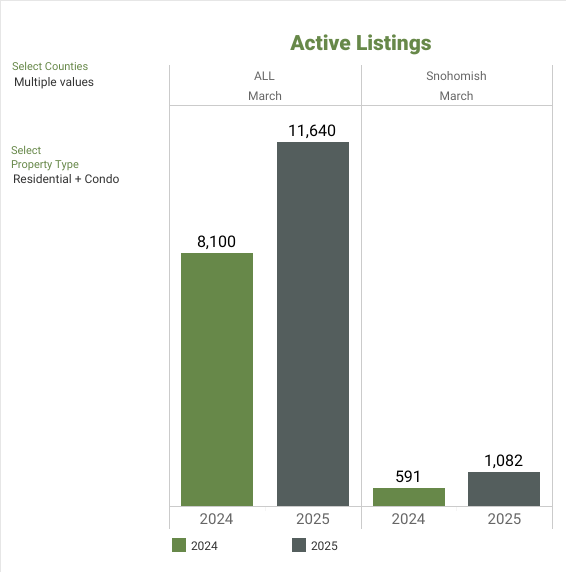
- There was a 43.7% increase in total number of properties listed for sale year-over-year, with 11,640 active listings on the market at the end of March 2025, compared to 8,100 at the end of March 2024. When compared to the previous month, active inventory increased by 1,192 listings (+11.4%), up from 10,448 in February 2025.
- The number of homes for sale year-over-year increased throughout the NWMLS coverage area, with 21 out of 26 counties seeing a double-digit year-over-year increase. The six counties with highest year-over-year increases in active inventory for sale were Snohomish (+83.1%), Whatcom (+63.1%), King (+59.8%), Cowlitz (+51.7), Kittitas (+48.3%), and Grant (+43.8%).
Closed Sales
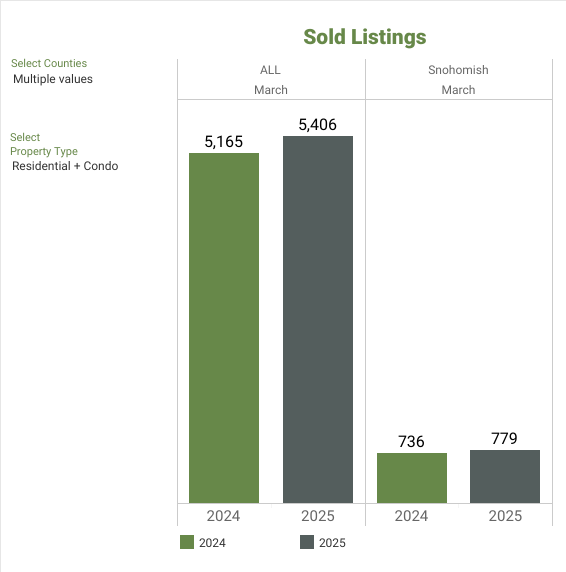
- The number of closed sales increased by 4.7% year-over-year (5,406 in March 2025 compared to 5,165 in March 2024). When compared to the previous month, the number of closed sales increased by 26.7%, up from 4,268 sales in February 2025.
- 15 out of 26 counties saw an increase in the number of closed sales year-over-year. The six counties with the largest increases were Douglas (+66.7%), Adams (+40%), Skagit (+35.3%), Jefferson (+34.6%), Chelan (+25%), and Cowlitz (+21.3%). The total dollar value of closed sales in March 2025 for residential homes was $3,907,557,990 and was $531,478,809 for condominiums $4,439,036,799 in total), an increase of 7% when compared to March 2024.
Median Sales Price
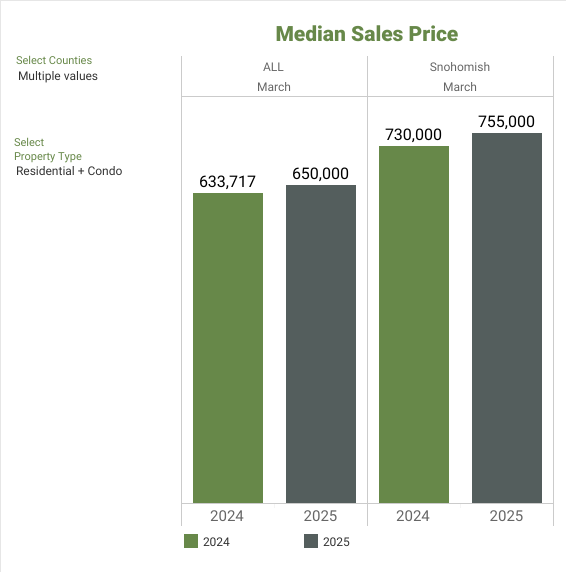
- Overall, the median price for residential homes and condominiums sold in March 2025 was $649,999, an increase of 2.6% when compared to March 2024 ($633,717). When compared to last month, the median price increased by 3.2%, up from $630,000 in February 2025.
- The three counties with the highest median sale prices were San Juan ($870,000), King ($855,000), and Snohomish ($755,000).
Consumer and Broker Activity
NWMLS also provided insights into consumer activities during March 2025:
- Keyboxes located at listed properties were accessed 155,005 times in March 2025, a 34% increase in activity from February 2025 when they were accessed 115,611 times.
Active Listings
There was a 43.7% increase in total number of properties listed for sale year-over-year, with 11,640 active listings on the market at the end of March 2025, compared to 8,100 at the end of March 2024. When compared to the previous month, active inventory increased by 1,192 listings (+11.4%), up from 10,448 in February 2025.
The number of homes for sale year-over-year increased throughout the NWMLS coverage area, with 21 out of 26 counties seeing a double-digit year-over-year increase. The six counties with highest year-over-year increases in active inventory for sale were Snohomish (+83.1%), Whatcom (+63.1%), King (+59.8%), Cowlitz (+51.7), Kittitas (+48.3%), and Grant (+43.8%).
Below is a graph of Snohomish County & ALL active listings in all 23 counties:
New Listings
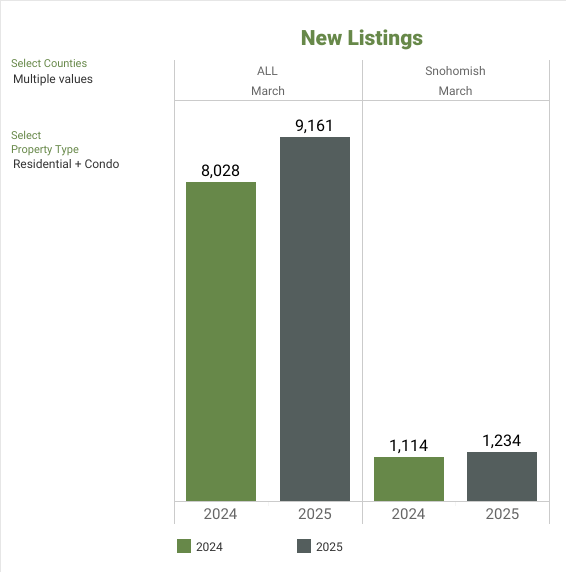
NWMLS brokers added 9,161 new listings to the database in March 2025, a year-over-year increase of 14.1% compared to March 2024 (8,028). When compared to the previous month (February 2025), new listings increased by 44.4%, when 6,346 listings were added to the NWMLS database.
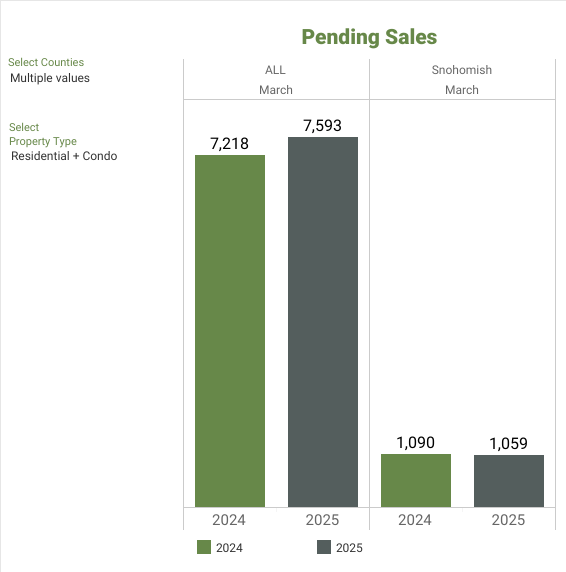
There were 7,593 residential units & condo units under contract in March 2025, an increase of 5.2% when compared to March 2024 (7,218). When compared to the previous month, the number of pending listings increased by 29.5%, up from 5,863 listings under contract in February 2025.
Below is a graph of Snohomish County & ALL new listings in all 23 counties:
Pending Sales
There were 7,593 residential units & condo units under contract in March 2025, an increase of 5.2% when compared to March 2024 (7,218). When compared to the previous month, the number of pending listings increased by 29.5%, up from 5,863 listings under contract in February 2025.
The number of pending sales increased year-over-year in 17 of 26 counties and rose in all but two counties when compared to pending sales last month. The six counties with the largest year-over-year increases in pending sales were Chelan (+39.3%), Island (+35.4%), Grays Harbor (+26.4%), San Juan (+26.3%), Jefferson (+23.5%), and Skagit (+22.3%).
Below is a graph of Snohomish County & ALL pending sales in all 23 counties:
Closed Sales
The number of closed sales increased by 4.7% year-over-year (5,406 in March 2025 compared to 5,165 in March 2024). When compared to the previous month, the number of closed sales increased by 26.7%, up from 4,268 sales in February 2025.
15 out of 26 counties saw an increase in the number of closed sales year-over-year. The six counties with the largest increases were Douglas (+66.7%), Adams (+40%), Skagit (+35.3%), Jefferson (+34.6%), Chelan (+25%), and Cowlitz (+21.3%). The total dollar value of closed sales in March 2025 for residential homes was $3,907,557,990 and was $531,478,809 for condominiums $4,439,036,799 in total), an increase of 7% when compared to March 2024.
Below is a graph of Snohomish County & closed sales in all 23 counties:
Months of Inventory
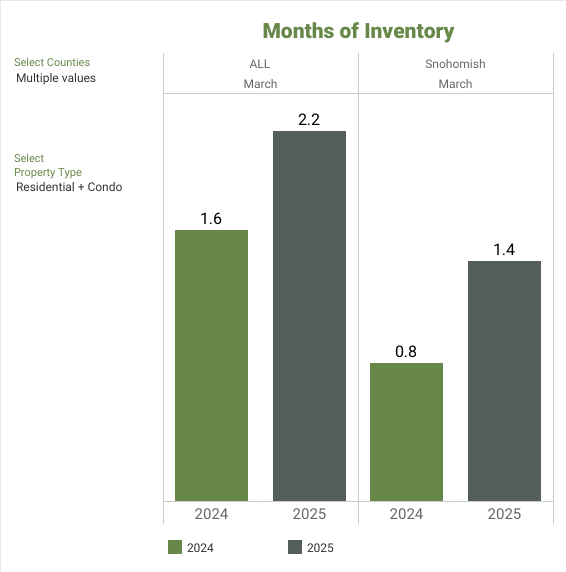
A balanced market is considered to be 4 to 6 months by most industry experts. At the current rate of sales, it would take a little more than two months (2.15) to sell every home that is active in the NWMLS inventory. The six counties with the lowest months of inventory in March 2025 were Snohomish (1.39), Pierce (1.67), Kitsap (1.86), King (1.86), Thurston (1.9), and Skagit (1.94).
Below is a graph of Snohomish County & ALL months of invenory in all 23 counties:
Median Price
Overall, the median price for residential homes and condominiums sold in March 2025 was $649,999, an increase of 2.6% when compared to March 2024 ($633,717). When compared to last month, the median price increased by 3.2%, up from $630,000 in February 2025.
The three counties with the highest median sale prices were San Juan ($870,000), King ($855,000), and Snohomish ($755,000).
Below is a graph of Snohomish County & ALL median prices in all 23 counties:
Where do we go from here?
Now is still a great time to sell your home as home values are holding strong and we do have pent-up buyer demand, the overpriced have tapered off, so sellers need to be reasonable in this more balanced market. Buyers now have a slight increase in inventory, giving them options. Buyers have more homes to choose from and we are seeing contingencies and finance options return. Although we are seeing some price adjustments I don’t recommend postponing purchasing, home values are expected to continue to rise in our area. If you think you are saving money by waiting, you should run the numbers. Economists and pundits in real estate all say “buy now”. The anticipated increase in equity across the next two-to-four years will be astonishing.
Northwest MLS Market Report
We continue to see price appreciation year-over-year in most areas. Potential sellers should act now, as this is still an excellent time to put their homes on the market due to low inventory. I will continue to follow the market trends and inform you each month as we move into summer.
Let’s get coffee, chat, or email back and forth if you have any questions about selling or buying real estate. If you want to know what your home is worth, have an interest in a particular area, or want to be put on a search to follow the market and home prices, just let me know. My team & I have many tools to help you make sound investment decisions!
Take a look at Snohomish County Housing Statistics.
March began with:
- 1,266 New Listings
- 1.6 Months’ worth of Inventory
- Median home price of $889,475
Let’s break it down per city:
| CITIES | MEDIAN SALES PRICE | % CHANGE OVER LAST YEAR | MONTHS OF INVENTORY |
| BOTHEL | $1,295,000 | 1.10% | 1.3 |
| LYNNWOOD | $1,046,995 | 0.87% | 1.4 |
| EVERETT | $839,950 | 0.97% | 1.6 |
| SNOHOMISH | $849,000 | 1.08% | 1.4 |
| LAKE STEVENS | $849,975 | 0.95% | 2.2 |
| MARYSVILLE | $789,990 | 1.01% | 1.6 |
What Does This Data Mean?

Inventory levels continue to be an issue in some places. Most places have 1.5 to two months of supply available; we are still in a seller-based market. However, we are moving to a balanced market. A balanced market is considered when we have approximately 4-6 months” worth of inventory. Due to the ongoing demand for real estate in Greater Seattle, I expect a moderate to robust real estate market going through 2025. We have seen prices holding steady to a slight increase, but I believe prices will continue to increase in the North Sound Region as we move through 2025, especially along the I-5 corridor.

What Does This Mean If You Are Buying A Home in Snohomish County
If you are buying a home in Snohomish County, you may see a pinch in inventory in certain locations; you may have to act quickly. Buyers are out there and very serious, often driving up prices. Interest rates continue to be uncertain. Be sure you are working with an experienced and knowledgeable agent when forming an offer and guiding through negotiations.
As of January 1st, 2024, buyers and agents must be in a “signed” Buyers Brokerage Services Agreement before entering homes. This is a NEW Washington state law. This new agreement clarifies agent commissions and makes the buying process more transparent. As a estate agent of 22+ years, managing broker for thirteen years, and the designated broker of Keller Williams North Sound in Marysville for eleven years, I’m held to a high standard. I am always on top of form revisions, real estate law & compliance!
This is the perfect time to sign up and receive email notifications when a new home is listed in the Snohomish County real estate market. Email and instant alerts give you an advantage over buyers looking for homes. Please fill out our form below so we can keep you ahead of the competition!
Ask Amy for an Email alert when a Snohomish County Home becomes available.

What Does This Mean If You Are Selling A Home In Snohomish County
Buyers are eager and shopping if you are selling a home in Snohomish County. This is still a seller’s market, and most sellers are getting their asking price and commonly getting over their list price.
Competition means your home needs to be priced competitively. Double-check to make sure your property is in optimum selling condition.
Check the home valuation calculator to get an estimated value for your home. Contact us for a comprehensive report. We work closely with sellers to create a marketing strategy that gets their listings in front of buyers who want to buy.
-Amy Wagner
425.239.2723
What’s Your Home Worth?
Instant Online Home Value Report
5 Things You Can Do To Make Your House Stand Out

About Amy Wagner – Prime Listings Group
“When You Do What You Love…People Love What You Do”
As a real estate agent, investor and managing broker of Keller Williams North Sound, Amy particularly loves helping people sell their homes fast and teaching and helping people build wealth through real estate investments such as multi-family homes, land development and the fix & flip of houses. She founded Prime Listings Group on the principles of doing better and giving more. We have local experience on our side and we promise to give more than expected. You’ve come to the right place. At PLG you can expect better!

“Great service from the start until closing….”
Amy sold my house quick and for more than I expected. Her whole team was excellent. Great service from the start until closing 10 out of 10⭐️’s!!! Thank you 🙏🏽 Amy Wagner