
What’s Your Home Worth?
Instant Online Home Value Report
Northwest MLS, the source for the most current, accurate market listing data in Washington State has released its Market Snapshot for August 2025.
Market Recap
In August 2025, there were 6,341 closed sales, representing a 5.74% decrease compared to August 2024 (6,727 sales). When compared to the previous month, closed sales decreased by 7.67%, down from 6,867 sales in July 2025.
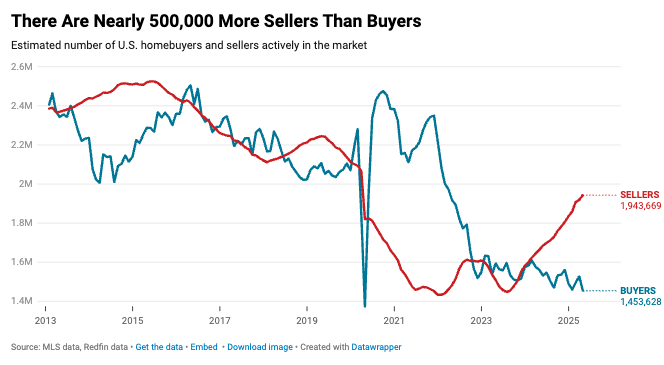
For-sale inventories are continuing to rise from historical lows, and that’s helping bring some life to housing market activity in the NWMLS area.
But questions still abound regarding one of the most critical aspects of today’s market, affordability, and the political and economic factors that influence it.
While increased inventory offers more options for buyers, the persistent affordability gap continues to pose challenges. Sellers may need to adjust expectations to align with buyer capabilities, potentially leading to price adjustments that could stimulate demand.
August 2025 Key Takeaways
Active Inventory For Sale
- There was a 30.8% increase in total number of properties listed for sale year-over-year, with 20,219 active listings on the market at the end of August 2025, compared to 15,453 at the end of August 2024. When compared to the previous month, active inventory decreased by 562 listings (-2.7%), down from 20,781 in July 2025.
- The number of homes for sale year-over-year increased throughout the NWMLS coverage area, with 25 out of 27 counties seeing a double-digit year-over-year increase (all counties except Adams, which increased by 5.9%, and Wahkiakum, which decreased by 12.1%)
Closed Sales
- The number of closed sales decreased by 5.7% year-over-year (6,341 in August 2025 compared to 6,727 in August 2024). When compared to the previous month, the number of closed sales decreased by 7.7%, down from 6,867 sales in July 2025.
- 15 out of 27 counties saw a decrease in the number of closed sales year-over-year, while 9 saw an increase, and 3 showed no change. The six counties with the largest increases were Clallam (+16.3%), Okanogan (+16.1%), Grant (+11.5%), Lewis (+8.3%), Island (+7.9%), and Douglas (+5.1%). The total dollar value of closed sales in August 2025 for residential homes was $4,669,643,977 and was $495,173,759 for condominiums ($5,164,817,736 in total).
Median Sales Price
- The median sales price for residential homes and condominiums sold in August 2025 was $650,000 — a slight increase of .8% when compared to August 2024 ($645,000). Compared to the previous month, the median price remained unchanged ($650,000 in July 2025).
- The three counties with the highest median sale prices were San Juan ($1,050,000), King ($875,000), and Snohomish ($755,000).
Consumer and Broker Activity
NWMLS also provided insights into consumer activities during August 2025:
- Keyboxes located at listed properties were accessed 164,711 times in August 2025, a 2.42% decrease in activity from July 2025 when they were accessed 168,801 times.
Active Listings
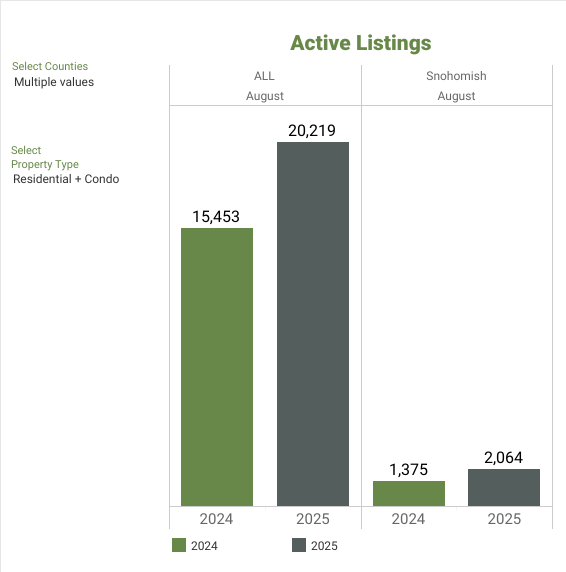
There was a 30.8% increase in total number of properties listed for sale year-over-year, with 20,219 active listings on the market at the end of August 2025, compared to 15,453 at the end of August 2024. When compared to the previous month, active inventory decreased by 562 listings (-2.7%), down from 20,781 in July 2025.
The number of homes for sale year-over-year increased throughout the NWMLS coverage area, with 25 out of 27 counties seeing a double-digit year-over-year increase (all counties except Adams, which increased by 5.9%, and Wahkiakum, which decreased by 12.1%). The six counties with highest year-over-year increases in active inventory for sale were Ferry (+63%), Snohomish (+50.1%), Jefferson (+47.3%), Clallam (+46.3%), Columbia (+45.8%), and Thurston (+38.9%).
Below is a graph of Snohomish County & ALL active listings in all 23 counties:
New Listings
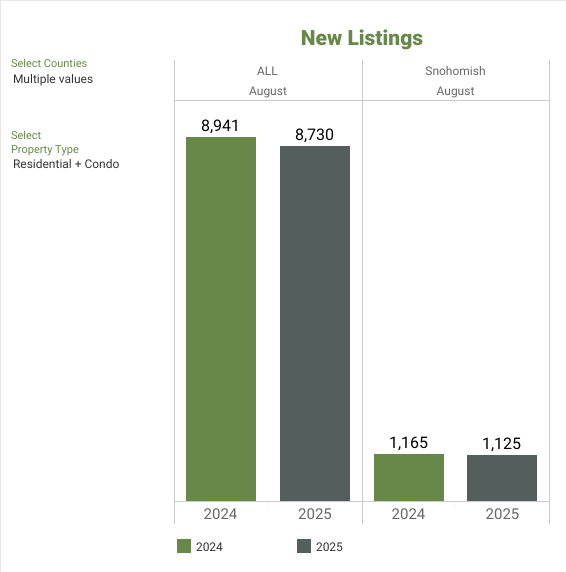
NWMLS brokers added 8,730 new listings to the database in August 2025, a year-over-year decrease of 2.4% compared to August 2024 (8,941). When compared to the previous month (July 2025), new listings decreased by 16.2%, when 10,418 listings were added to the NWMLS database.
When looking at the 27 individual counties in NWMLS’s primary service area, the number of new listings increased year-over-year in 14 counties, decreased year-over-year in 12 counties, and did not change in 1 county (Adams). The six counties with the largest year-over-year increases were Okanogan (+28.6%), Island (+23.5%), San Juan (+19.5%), Grant (+15.6%), Columbia (+14.3%), and Jefferson (+10.8%).
Below is a graph of Snohomish County & ALL new listings in all 23 counties:
Pending Sales
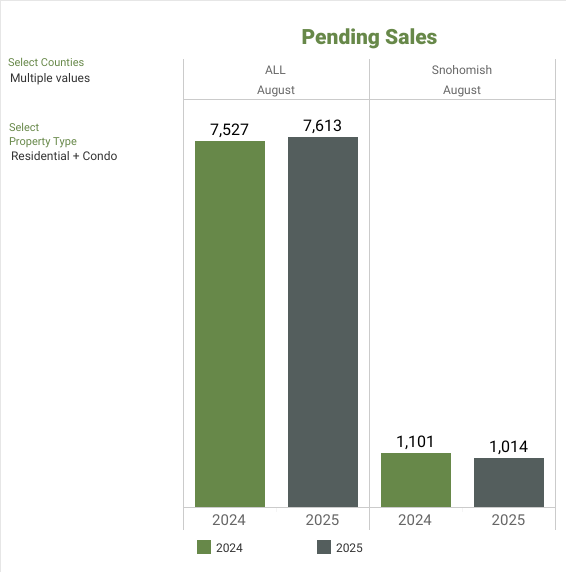
There were 7,613 residential units & condo units under contract in August 2025, an increase of 1.1% when compared to August 2024 (7,527). When compared to the previous month, the number of pending listings decreased by 1.9%, down from 7,764 listings under contract in July 2025.
Below is a graph of Snohomish County & ALL pending sales in all 23 counties:
Closed Sales
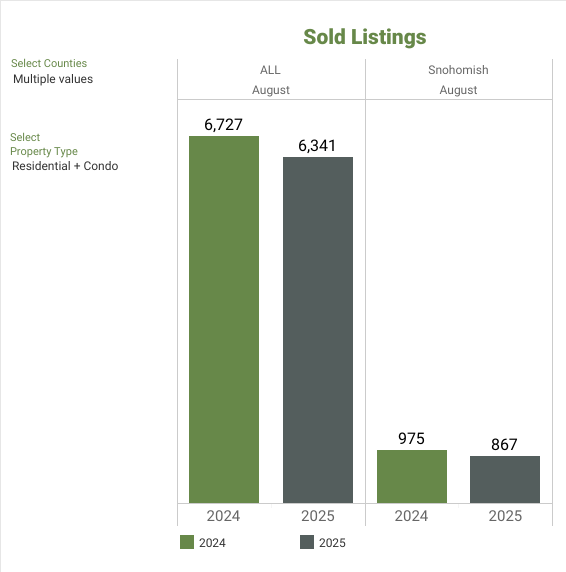
The number of closed sales decreased by 5.7% year-over-year (6,341 in August 2025 compared to 6,727 in August 2024). When compared to the previous month, the number of closed sales decreased by 7.7%, down from 6,867 sales in July 2025.
15 out of 27 counties saw a decrease in the number of closed sales year-over-year, while 9 saw an increase, and 3 showed no change. The six counties with the largest increases were Clallam (+16.3%), Okanogan (+16.1%), Grant (+11.5%), Lewis (+8.3%), Island (+7.9%), and Douglas (+5.1%). The total dollar value of closed sales in August 2025 for residential homes was $4,669,643,977 and was $495,173,759 for condominiums ($5,164,817,736 in total).
Below is a graph of Snohomish County & closed sales in all 23 counties:
Months of Inventory
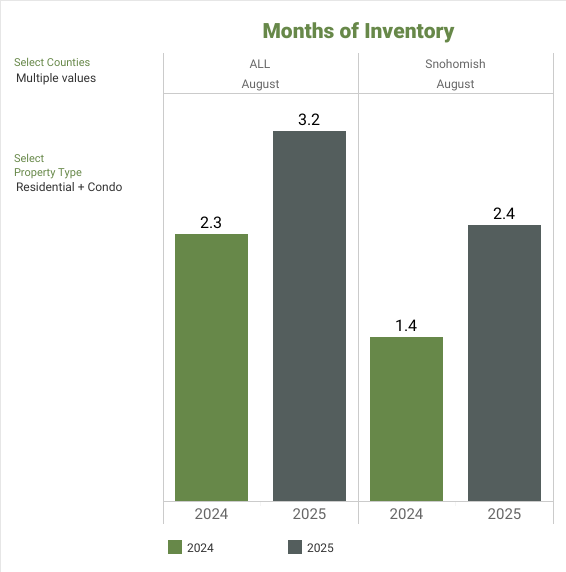
A balanced market is considered to be 4 to 6 months by most industry experts. At the current rate of sales, it would take a little longer than 3 months (3.19) to sell every home that is active in the NWMLS inventory. The six counties with the lowest months of inventory in August 2025 were: Kitsap (2.13), Snohomish (2.38), Thurston (2.54), Pierce (2.58), King (2.86) and Clallam (3.28).
Below is a graph of Snohomish County & ALL months of invenory in all 23 counties:
Median Price
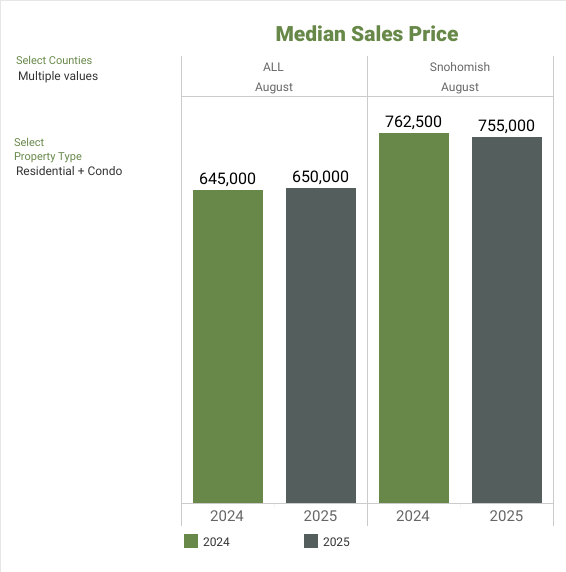
The median sales price for residential homes and condominiums sold in August 2025 was $650,000 — a slight increase of .8% when compared to August 2024 ($645,000). Compared to the previous month, the median price remained unchanged ($650,000 in July 2025).
The three counties with the highest median sale prices were San Juan ($1,050,000), King ($875,000), and Snohomish ($755,000), and the three counties with the lowest median sale prices were Ferry ($250,000), Columbia ($319,000), and Grays Harbor ($323,500).
Below is a graph of Snohomish County & ALL median prices in all 23 counties:
Where do we go from here?
Now is still a great time to sell your home as home values are holding strong and we do have pent-up buyer demand, the overpriced have tapered off, so sellers need to be reasonable in this more balanced market. Buyers now have a slight increase in inventory, giving them options. Buyers have more homes to choose from and we are seeing contingencies and finance options return. Although we are seeing some price adjustments I don’t recommend postponing purchasing, home values are expected to continue to rise in our area. If you think you are saving money by waiting, you should run the numbers. Economists and pundits in real estate all say “buy now”. The anticipated increase in equity across the next two-to-four years will be astonishing.
Northwest MLS Market Report
We continue to see price appreciation year-over-year in most areas. Potential sellers should act now, as this is still an excellent time to put their homes on the market. I will continue to follow the market trends and inform you each month as we move into fall.
Let’s get coffee, chat, or email me if you have any questions about selling or buying real estate. If you want to know what your home is worth, have an interest in a particular area, or want to be put on a search to follow the market and home prices, just let me know. My team & I have many tools to help you make sound investment decisions!
Take a look at Snohomish County Housing Statistics.
August began with:
- 1,684 New Listings
- 2.30 Months’ worth of Inventory
- Median home price of $790,000
Let’s break it down per city:
| CITIES | MEDIAN SALES PRICE | % CHANGE OVER LAST YEAR | MONTHS OF INVENTORY |
| BOTHELL | $1,150,000 | 0.00% | 2.60 |
| LYNNWOOD | $850,000 | 1.69% | 1.89 |
| EVERETT | $837,450 | 11.07% | 1.91 |
| SNOHOMISH | $735,000 | 11.37% | 2.67 |
| LAKE STEVENS | $725,000 | 3.57% | 2.86 |
| MARYSVILLE | $670,354 | 0.05% | 2.31 |
What Does This Data Mean?

The data indicates a significant shift in the housing market across the NWMLS coverage area. Inventory is on the rise, with a 30.8% year-over-year increase in active listings, totaling 20,219 properties at the end of August 2025, though this is slightly down from July’s numbers. This trend suggests more homeowners are listing properties, potentially giving buyers more options. Despite the increased inventory, closed sales are declining, down 5.7% from August 2024 and 7.7% from July 2025, implying a potential cooling in buyer activity. Most counties (15 out of 27) experienced a drop in closed sales, though a few saw notable increases. The median sales price remained relatively stable, up just 0.8% year-over-year to $650,000, with no change from the previous month. This stability in pricing, despite more listings and fewer sales, may indicate a market in transition, balancing between buyer hesitation and seller expectations.
What Does This Mean If You Are Buying A Home in Snohomish County
For buyers, the current market conditions are becoming more favorable. The 30.8% increase in active listings year-over-year means more choices and potentially less competition for homes. As inventory grows and sales decline, buyers may gain stronger negotiating power, especially with fewer bidding wars. The slight increase in median home prices (just 0.8% year-over-year) and price stability month-over-month suggest that prices are leveling off, giving buyers more predictability. With sales slowing in over half of the counties, motivated sellers may be more open to price reductions or concessions. Overall, this market shift could present a good opportunity for buyers who have been waiting for less competitive conditions.
This is the perfect time to sign up and receive email notifications when a new home is listed in the Snohomish County real estate market. Email and instant alerts give you an advantage over buyers looking for homes. Please fill out our form below so we can keep you ahead of the competition!
Ask Amy for an Email alert when a Snohomish County Home becomes available.

What Does This Mean If You Are Selling A Home In Snohomish County
For sellers, the data suggests a more competitive market is emerging. With a 30.8% year-over-year increase in active listings, there are significantly more homes on the market, meaning sellers face more competition for buyers’ attention. At the same time, closed sales are down 5.7% compared to last year and 7.7% from the previous month, indicating that fewer buyers are making purchases. While median prices have remained stable, with a modest 0.8% year-over-year increase, this stability may not hold if inventory continues to rise and buyer demand stays soft. Sellers may need to be more strategic with pricing, presentation, and concessions to attract offers, especially in areas where sales are slowing. Overall, it’s still a solid market, but sellers should prepare for longer selling times and the need to stand out among a growing number of listings.
Double-check to make sure your property is in optimum selling condition.
Check the home valuation calculator to get an estimated value for your home. Contact us for a comprehensive report. We work closely with sellers to create a marketing strategy that gets their listings in front of buyers who want to buy.
-Amy Wagner
425.239.2723
What’s Your Home Worth?
Instant Online Home Value Report
5 Things You Can Do To Make Your House Stand Out

About Amy Wagner – Prime Listings Group
“When You Do What You Love…People Love What You Do”
As a real estate agent, investor and managing broker of Keller Williams North Sound, Amy particularly loves helping people sell their homes fast and teaching and helping people build wealth through real estate investments such as multi-family homes, land development and the fix & flip of houses. She founded Prime Listings Group on the principles of doing better and giving more. We have local experience on our side and we promise to give more than expected. You’ve come to the right place. At PLG you can expect better!

“Great service from the start until closing….”
Amy sold my house quick and for more than I expected. Her whole team was excellent. Great service from the start until closing 10 out of 10⭐️’s!!! Thank you 🙏🏽 Amy Wagner